2026-07-29T07:32:14.678Z
OpenClaw Dashboard: Audit Four Layers Before Trusting Green
Separate the Control UI surface, authenticated Gateway, selected agent and run, and verified outcome with a reproducible six-case health audit.
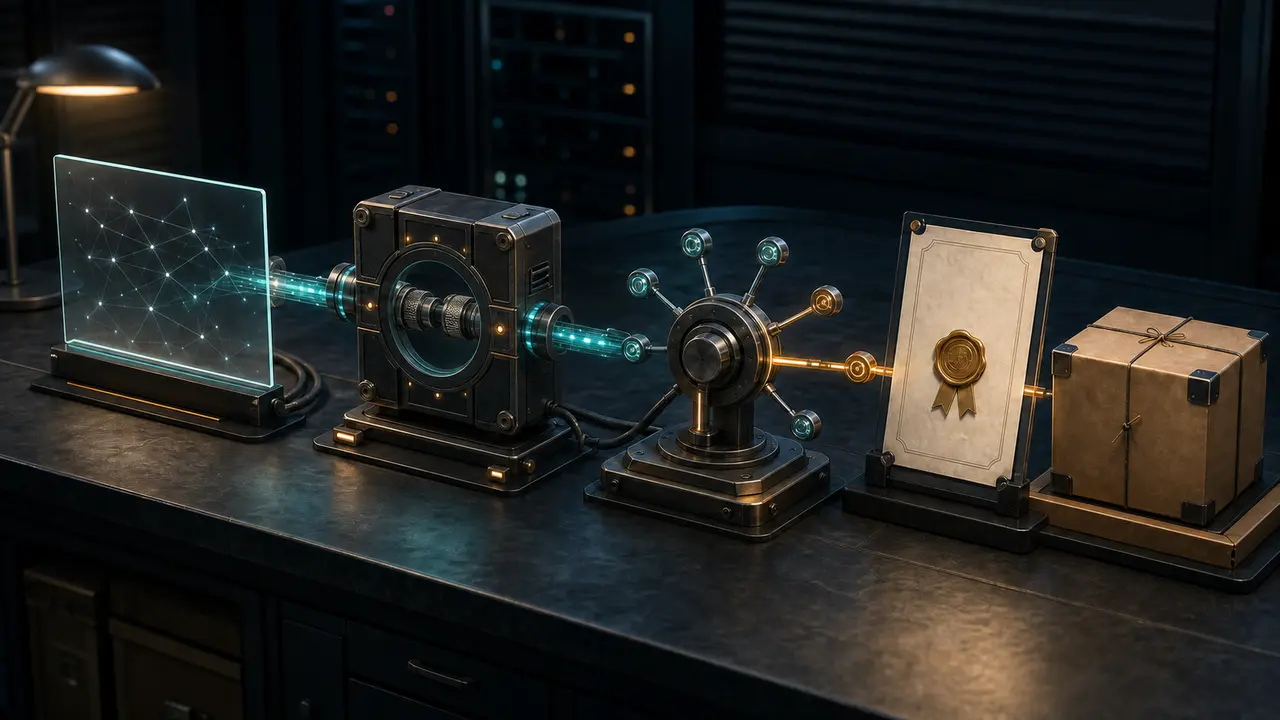
The short answer is: an OpenClaw dashboard that loads is not yet evidence that an agent is healthy. Treat the Control UI as four separate checks: the browser surface loaded, the Gateway accepted an authenticated WebSocket connection, the dashboard is showing the intended agent and current run, and the promised result exists. Only the last condition closes the task. That distinction matters because each layer can be green while the next one is broken. Static assets can render while the WebSocket is disconnected. A Gateway can answer while the selected session belongs to another agent. A cron run can be accepted but not finished. A session can say complete while the file, message, deployment, or other deliverable is missing. The practical default is to open the official Control UI through a private path, collect fresh machine-readable evidence, and stop at the first failed layer. Do not expose the dashboard publicly: OpenClaw documents it as an admin surface with chat, configuration, and execution approvals. Open the Control UI, then prove the Gateway connection For a local Gateway, the documented dashboard lives at http://127.0.0.1:18789/ unless gateway.controlUi.basePath changes the path. The safest normal entry point is the CLI: On a headless host, use: Do not paste a tokenized dashboard URL into a ticket, shell transcript, article, or chat. The official dashboard guide recommends localhost, Tailscale Serve, or an SSH tunnel and explains the supported token, password, Tailscale identity, and trusted-proxy authentication paths. A new non-loopback browser may also require device pairing. Pairing failure, authentication failure, and reachability failure are different incidents; rotating a token does not repair all three. The browser application speaks directly to the Gateway WebSocket on the same port. That architecture creates the first useful boundary: - Surface evidence: the HTTP response and JavaScript application loaded. - Connection evidence: the WebSocket authenticated and current RPCs succeed. A rendered shell proves only the first item. The Control UI can remain visible during a dropped connection while it retries with backoff. That behavior is helpful to an operator, but it means “I can still see the dashboard” is not a live health test. Ask the running Gateway for current evidence instead: status --deep requests a live probe. health --json returns a machine-readable health snapshot including ok , ts , durationMs , channel state, agent availability, and a session-store summary. Record the timestamp with the verdict. A previous ok: true without a freshness rule is a stale green light. Audit four evidence layers in order Use one precedence rule: never let a later-looking success hide an earlier unknown. The four layers answer different questions. Layer Question Minimum evidence What it does not prove --- --- --- --- UI surface Did the browser receive and run the Control UI? Expected HTTP status, application registration, correct base path Gateway authentication or agent reachability Gateway Is this browser authenticated to a live Gateway now? Successful current RPC, health timestamp, required operator scope Correct agent, current task, or completed work Work scope Is the view tied to the intended agent, canonical session, and expected run? Agent ID, session key, run ID, update time, state, owned wait The external deliverable exists Outcome Did the requested effect or artifact pass its acceptance rule? Destination-specific receipt with verifier and time Future stability unless a window is required The order prevents three common mistakes. First, stored activity is not liveness. The OpenClaw health guide explicitly warns that session rows come from stored conversation state and are not provider socket liveness. A recent-looking session is useful work evidence, but it cannot replace a channel or Gateway probe. Second, scope is part of health. Multi-agent Control UI setups can switch agent scope, and every pane can hold its own session. Before judging progress, capture the expected agentId , the selected agentId , and the canonical sessionKey . If they disagree, the verdict is WRONG AGENT SCOPE , not “the agent is idle.” This is especially important after opening a deep link, changing browser profiles, or returning to a split view. Third, accepted work is not finished work. The Gateway protocol describes cron.run as enqueue-style. A client that needs completion must keep the returned runId and poll cron.runs . The dashboard button working therefore proves that a request was accepted, not that the isolated agent turn finished. Use the same discipline for waiting. A run is legitimately waiting when the dependency is known, the right owner has been notified, a deadline exists, and the session can resume. It is stuck when no meaningful progress is visible and no valid dependency explains the pause. Restarting an owned wait can duplicate work or discard the state needed to continue. Replay the gate against inconvenient cases I built a small deterministic classifier around this precedence. The fixture contains six deliberately different states: 1. the page loaded but no authenticated Gateway RPC succeeded; 2. the Gateway says healthy, but its evidence is five minutes old; 3. the view is fresh but points at the wrong agent; 4. the intended session is waiting with an owner and deadline; 5. the run says complete but has no outcome receipt; 6. the run is fresh, correctly scoped, complete, and backed by a receipt. Run it with: The fixed report is: The classifier uses a 60-second evidence window for the fixture. That is an example, not a universal OpenClaw default. A two-minute interactive run and a daily research job need different expiry policies. Set the window from the expected update cadence, the cost of probing, and the harm of acting on stale evidence. Store the chosen threshold beside the result. The important part is the ordering: This script validates evidence shape and precedence. It does not prove that a receipt is honest. A receipt needs a destination-specific verifier: hash and existence for a file, HTTP and content checks for a page, provider ID and delivery state for a message, test output for a code change, or a query against the system that owns an external side effect. Repair the first failed layer, not the most visible symptom When the audit fails, use the narrowest safe action. Verdict Likely boundary Next action --- --- --- UI UNREACHABLE HTTP, base path, browser bundle, or host access Verify the documented URL and Gateway process before changing agent config GATEWAY UNVERIFIED WebSocket reachability, auth, pairing, or scope Run a deep status/health probe and follow the exact 1008 reason STALE GATEWAY EVIDENCE Old cached snapshot Refresh; keep the verdict unknown until fresh evidence arrives WRONG AGENT SCOPE Selected agent/session differs from the task Resolve the canonical agent and session, then re-read progress WAITING OWNED Valid external or human dependency Keep owner, deadline, and resume state visible OUTCOME UNVERIFIED Execution ended before destination verification Run the acceptance check; do not clear completion HEALTHY All required evidence is fresh and scoped Retain timestamps, run identity, and the outcome receipt This rule also limits authority. The Control UI can edit config, run cron jobs, cancel tasks, and manage approvals. A diagnostic failure does not automatically authorize those mutations. Explain the failed layer, propose the smallest reversible action, and require explicit approval where the action changes state. For remote access, keep the admin boundary intact. The official docs prefer private access through localhost, Tailscale Serve, or an SSH tunnel. Do not “fix” dashboard reachability by exposing the Control UI publicly or disabling device authentication. An availability repair that weakens the control plane is not a healthy recovery. The dashboard is evidence, not the outcome The useful operating model is now compact: - the browser surface shows whether the operator interface loaded; - the Gateway probe shows whether control-plane evidence is current; - the selected agent, session, and run identify the work being judged; - the outcome receipt proves whether the user’s task actually finished. Keep those boundaries even if a future dashboard combines them on one screen. A single card can display several signals, but it should not collapse their provenance or timestamps into one unqualified green state. Sidewisp’s intended role is a health layer around agents that continue to run in systems such as OpenClaw. Sidewisp is currently in private preview. Its production monitoring adapters and recovery engine are not generally shipped, so this article describes an operator method and reproducible artifact, not a current automated Sidewisp integration. If this evidence boundary matches the silent failures you need to catch, you can join the private preview from the Sidewisp site. Sources - OpenClaw Dashboard, inspected against OpenClaw 2026.7.1-2 - OpenClaw Control UI, inspected against OpenClaw 2026.7.1-2 - OpenClaw Health Checks, inspected against OpenClaw 2026.7.1-2 - OpenClaw Gateway Protocol, inspected against OpenClaw 2026.7.1-2 - OpenClaw Dashboard CLI, inspected against OpenClaw 2026.7.1-2